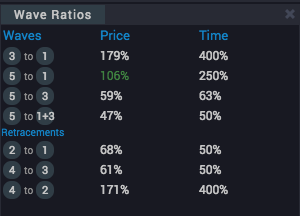
When the Wave Ratios gadget is active in your workspace, whenever you hover your mouse over a wave in the chart – or – if you hover over one of the Next Subwaves, the ratios between the various subwaves of the pattern you are inspecting are displayed in the gadget.
The ratios compares the lengths of the individual subwaves of a given wave, showing the ratios between them, as well as the ratios between the amount of time that it took to complete each subwave. This is useful for determining how well a given wave pattern fits into standard guideline expectations.
For example, a ratio indication of “C to A: 112%” means that the length of wave C was 1.12 times the length of wave A.
If any of the ratios are displayed in green, this indicates that the particular ratio is within a margin of error of the highest probability expected range, according to commonly accepted Elliott Wave guidelines.
The ratios section can be particularly useful when you’re drawing your own waves, since the pane will update in real time as you move waves around on the chart.
If you’re used to tracking this kind of thing by hand, having it done for you instantly is a great way to accelerate your workflow.