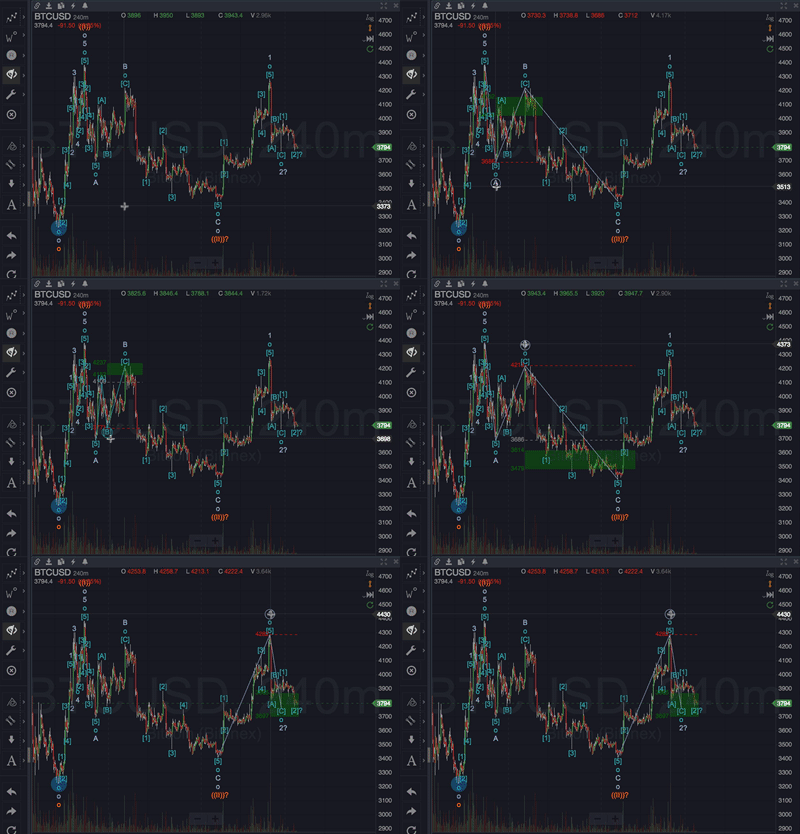
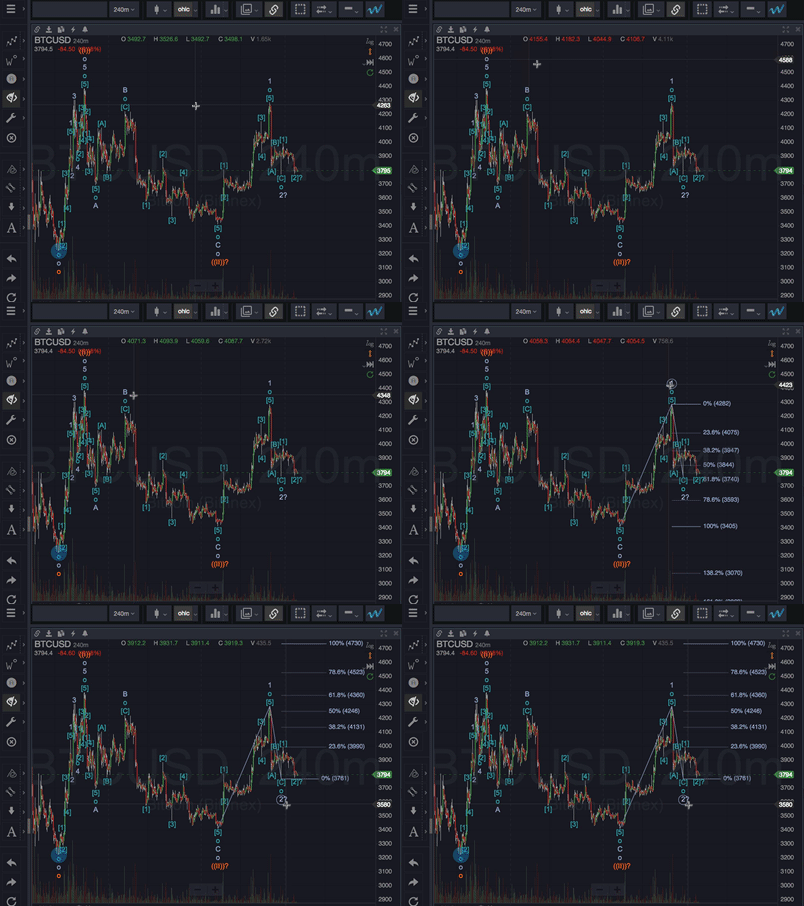
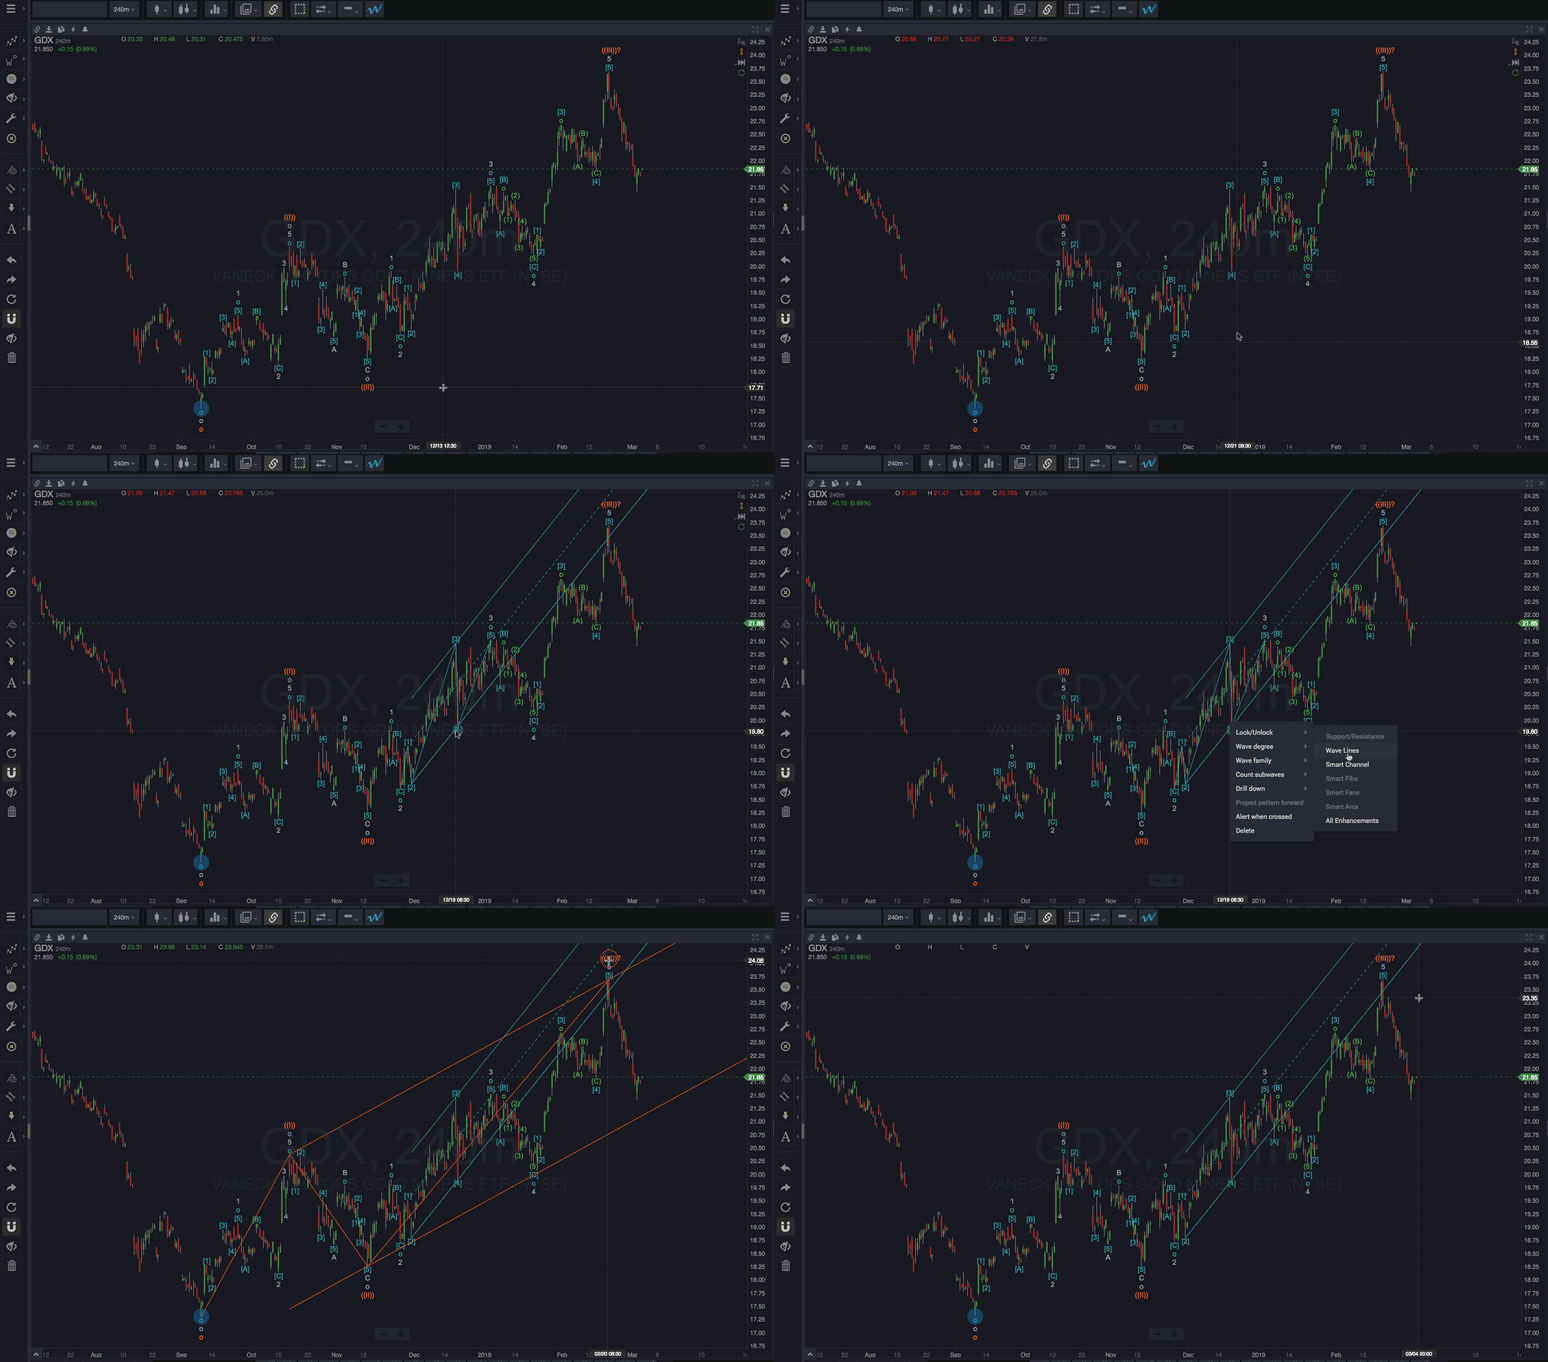
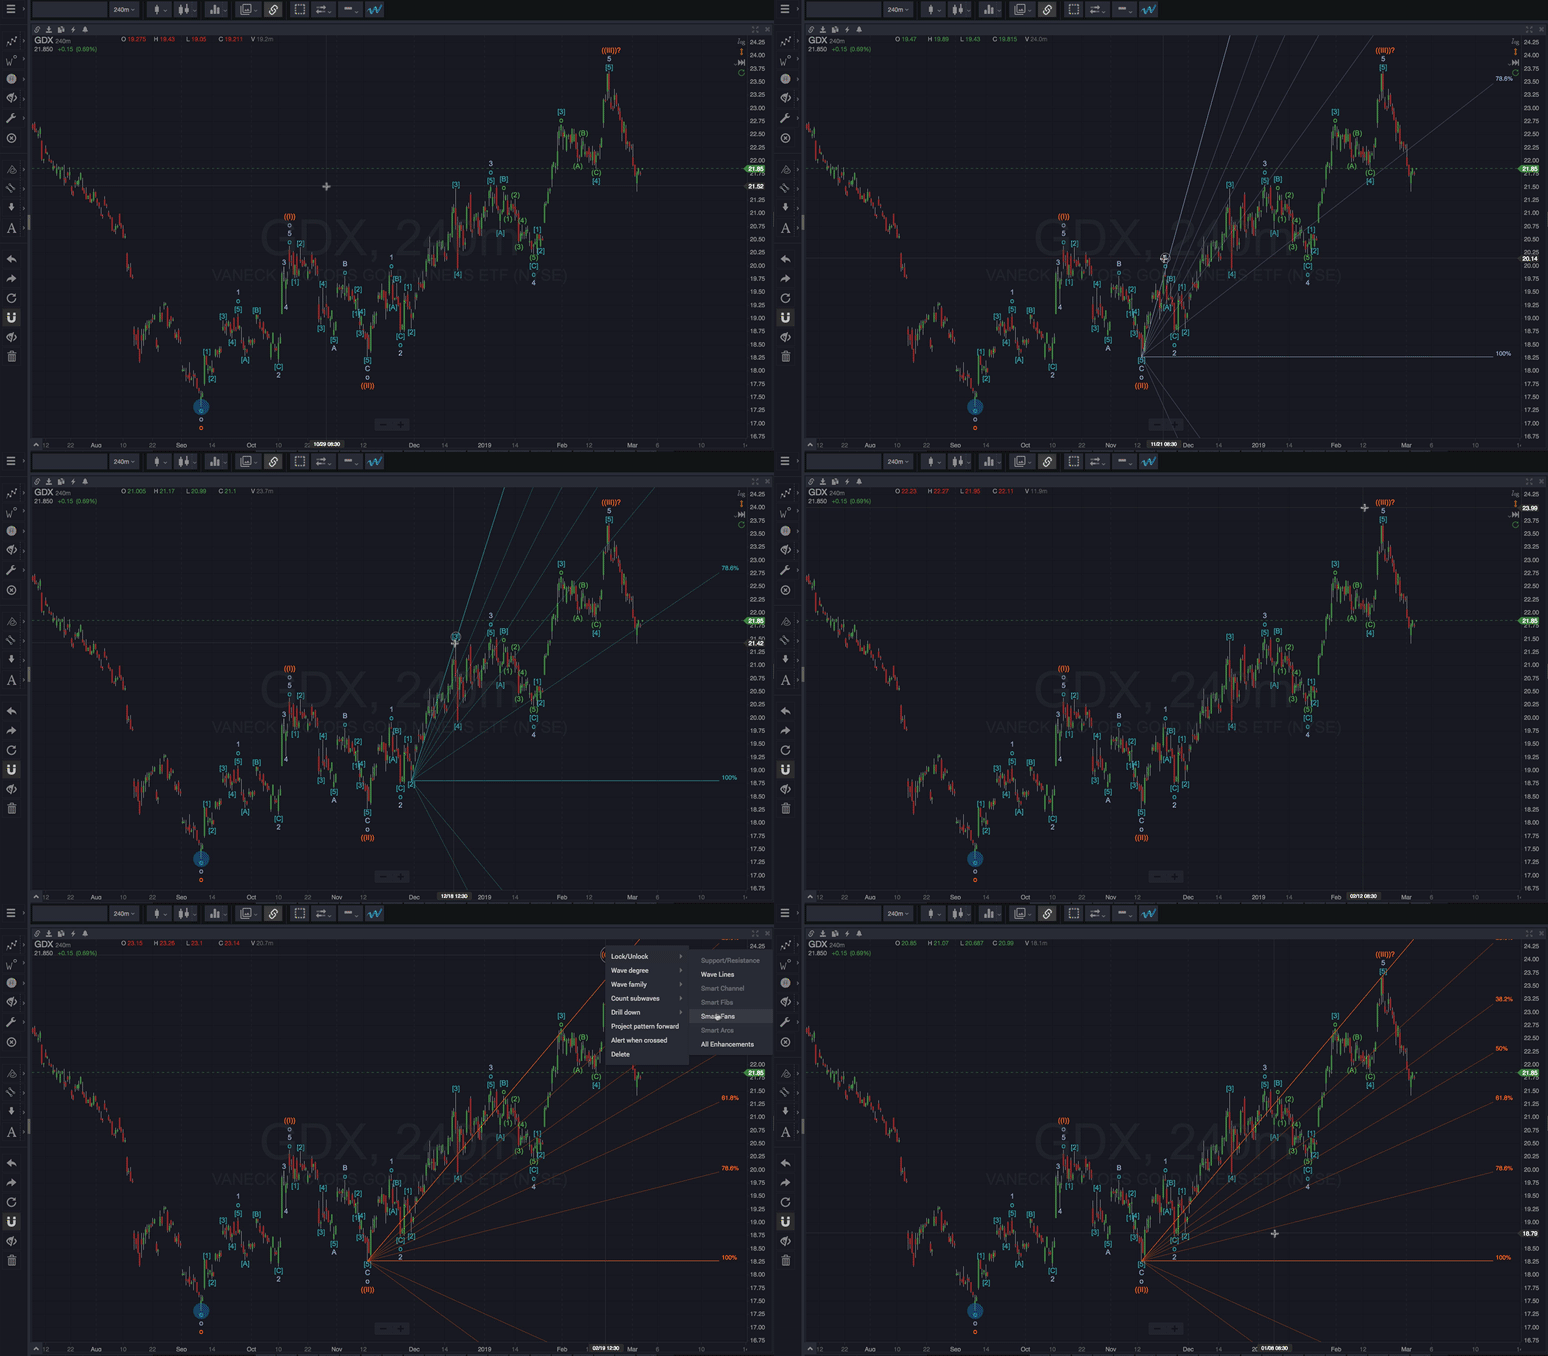
Smart Support/Resistance
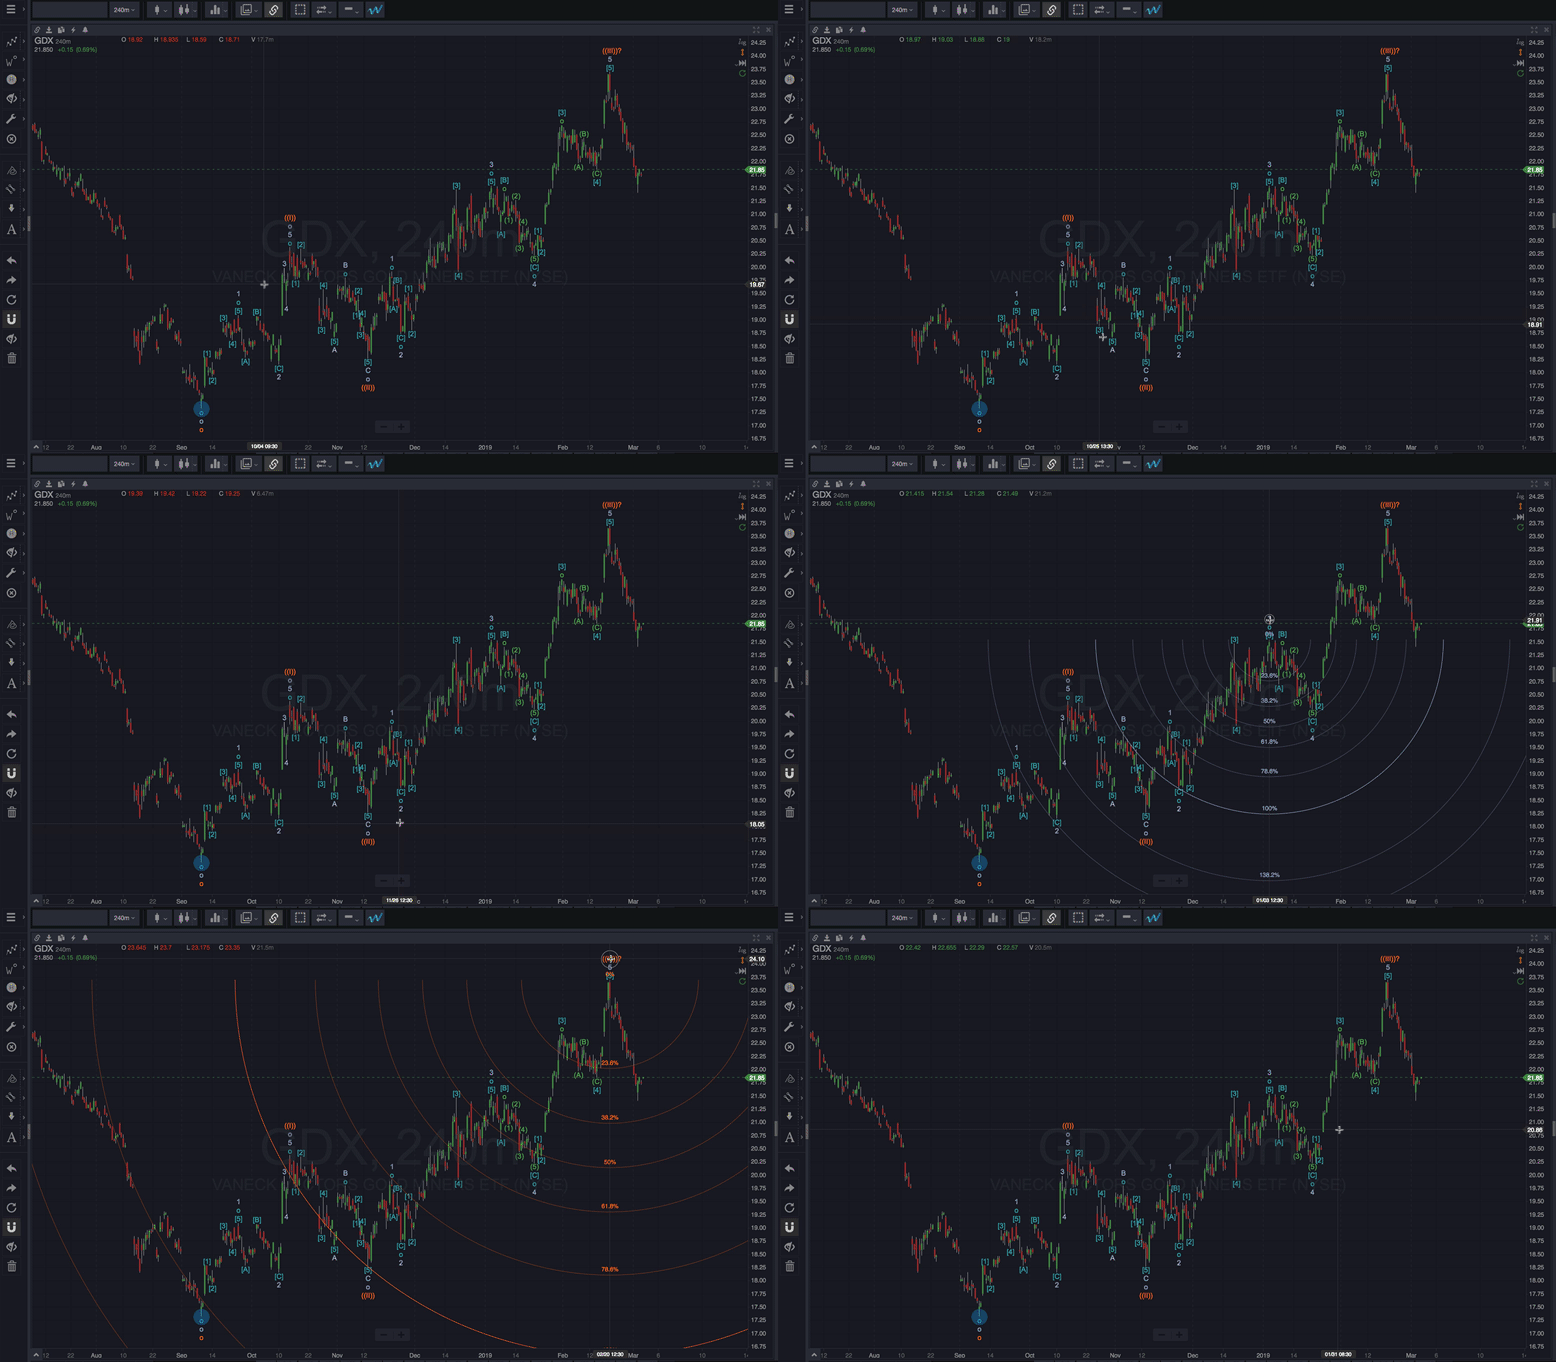
When enabled, hovering your mouse over a wave label will automatically show minimum target support or resistance areas (depending on the wave) for the next wave in the pattern, using standard fibonacci mathematics and statistical modeling. Support/Resistance areas are not predictions per se, they are the highest probability zones for the next market turning point based on the current pattern, and they align with commonly accepted Elliott Wave expectations.
Smart Support and Resistance areas are an extremely powerful guide to anticipating market turning points and identifying high probability entries/exits. And, when combined with features like Timeframe Drilldown can help lead the way to quite accurate timing.
Additionally, inspecting past support/resistance areas is a key component of evaluating and building confidence in a given Elliott Wave count. The more in line with statistical expectations a given wave count is at various degrees, the more confidence is suggested.
Smart Fibs™
When enabled, hovering your mouse over a wave label will automatically show Fibonacci retracement or extension levels, depending on the wave. The Smart Fibs know when you’re interested in extensions versus retracements based on the wave that you hover over. Hover a wave 1 to see the Fibonacci retracement levels in anticipation of wave 2. Hover a wave 2 to see Fibonacci extension levels in anticipation of wave 3.
Smart Elliott Channels™
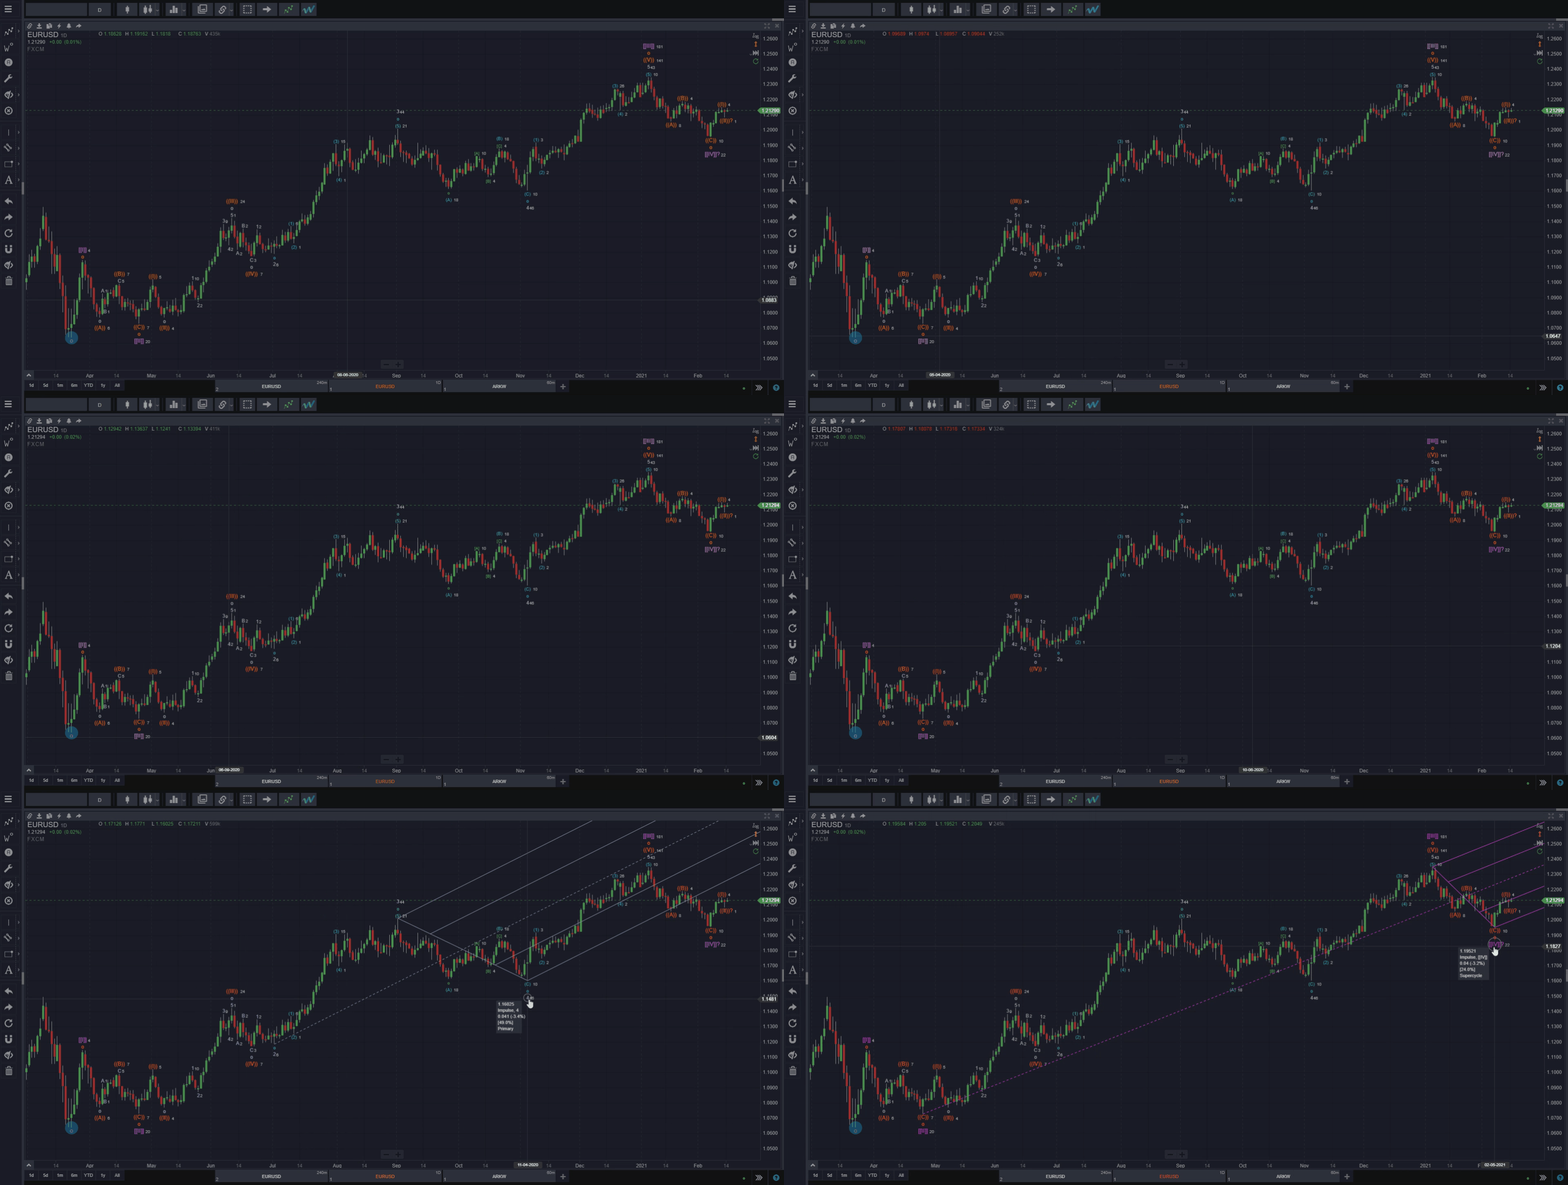
When enabled, hovering your mouse over a wave label will automatically show Elliott Trend Channels calculated up through the selected wave. So, when you hover a wave in a pattern, the channel that is displayed is the same channel that you would have been able to calculate at the point in time that the wave occurred. Hence, when you hover a wave 1 in an impulse pattern, no Elliott Trend Channel will be displayed.
Smart Fans™
When enabled, hovering your mouse over a wave label will automatically show Fibonacci fan retracement levels.
Smart Arcs™
When enabled, hovering your mouse over a wave label will automatically show Fibonacci retracement or extension arcs, depending on the wave.
Smart Pitchforks
When enabled, hovering your mouse over a wave label will automatically show the Smart Pitchfork for the wave in question. You can select your preferred style of pitchfork (Andrew’s, Schiff, or Modified Schiff) in the Smart Tools tab in the platform settings menu.
Show Wave Lines
When enabled, hovering your mouse over a wave label will show the lines connecting the subwaves of the wave pattern. You can lock the wave lines of a pattern on the chart by right-clicking on any wave in the pattern, then selecting “Lock/Unlock” in the pop-up menu, followed by clicking on “Wave Lines”.
Learn more about modifying waves and patterns.
Show All Lines
Click this to toggle on and off the lines between all wave points that are currently on the chart. It might be useful to use the “Hide waves below a specific degree” function while displaying all the wave lines to keep your workspace tidy.
Show # Bars
This feature places the number of bars it took for a particular wave to complete next to the wave label on your chart. This feature allows you to quickly see how price action has been behaving whilst forming waves.
Show wave info
Wave info refers to the dialog box that pops up when you hover over one of the waves in a wave pattern. You’ll be able to see the price level of the wave, the type of wave pattern, the most recently completed subwave in the emerging pattern, the number of points the wave comprises of, what the wave represents in terms of a percentage move on the instrument, the ratio of the wave in comparison to it’s preceding wave, and lastly, the degree of the wave.

