The Chart Manager keeps your charts organized by symbol/ticker and time frame, and you can assign your own title to each chart. The default title for a chart will always be the date and time that it was saved, but you can change the title simply by double-clicking on the default title and entering a new name.
Single-clicking on a chart’s title in the manager will display the chart in the currently selected chart in your workspace.
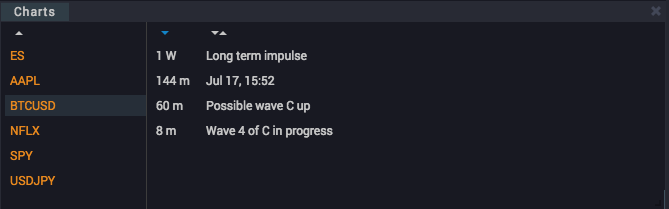
You can sort charts by name or time frame by clicking the sorting controls at the top of the time frame and chart name columns. You can also sort the symbol column by clicking the sort control at the top of that column.
You can save a chart by clicking the save icon in the chart’s top tool bar as shown below, and any drawings, wave counts, or studies that you’ve added will be saved along with the chart, for easy recall later on. You never have to worry about losing your hard work again, and long term tracking of wave counts has never been easier.
![]()
You can add the Chart Manager to your workspace, either in the right sidebar gadget area, or in the Insight gadget area at the bottom of your workspace, And, like all the other gadgets, it can be dragged, sized, and positioned in the way that you choose.
Also, like all charts in WaveBasis, saved charts remain interactively linked to the Insight Gadgets, so you can continue to inspect wave ratios, next subwave projections, and the wave guide in real time.