Yes!
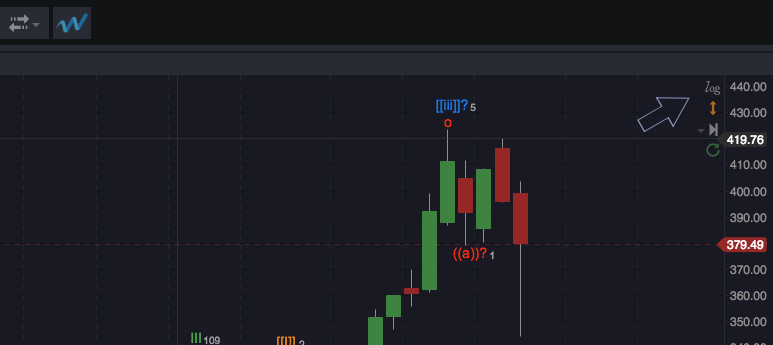
Whenever you hover your mouse over a chart, the axis tools will display in the upper right corner of the chart, next to the price scale. Click the “log” icon, as shown below, to toggle the logarithmic (“semi-log”) price scale.
Yes!
Whenever you hover your mouse over a chart, the axis tools will display in the upper right corner of the chart, next to the price scale. Click the “log” icon, as shown below, to toggle the logarithmic (“semi-log”) price scale.