You can quickly clear (DELETE!) all waves that are currently on the chart, while leaving other types of drawings undisturbed. Simple click the Clear waves button in the left toolbar as shown below.

You can quickly clear (DELETE!) all waves that are currently on the chart, while leaving other types of drawings undisturbed. Simple click the Clear waves button in the left toolbar as shown below.
Choose a degree from the menu to hide all waves below that degree. This is useful for hiding wave detail at smaller time scales, when you want to temporarily remove some wave label clutter from the chart, such as for evaluating longer trading horizons.
This is also especially useful for clarifying larger timeframe context in a particularly dense automatic wave count.

There are a number of ways to interact with and modify wave patterns and counts after they have been added to a chart. From repositioning waves by drag-and-drop to changing entire patterns, there are virtually no limitations to how waves can be modified to suit your analysis objectives. This is particularly important and useful for more experienced Elliott Wave analysts and traders.
Also, unlike other tools that provide automatic wave counts, you can interact with automatic wave counts in WaveBasis in exactly the same way that you can with manually-drawn waves. So, if you’d like to examine a wave pattern idea that is slightly different than the patterns in an automatic wave count, simply drag-and-drop waves, change the pattern type, delete or add new patterns at any wave degree.
Additionally, there are a number of wave and pattern operations that can be accessed by right-clicking on any wave and selecting from the menu that appears, as described below.
If you right-click on any wave, a menu will open with options for modifying or deleting that wave or the entire wave pattern.

The menu options are explained below:
By default, Smart Tools only display when you are hovering your mouse over a particular wave. Use the Lock/Unlock feature to lock a given Smart Tool chart enhancement or all enabled Smart Tools onto the chart. For example, it’s often convenient to lock Support/Resistance areas or Fibonacci Levels in place on a chart as you proceed through an analysis.
Use this to change the degree of a wave pattern. See also Choosing a wave degree.
Use this to change a wave pattern’s family or “type”. This is useful for examining alternative possibilities for an existing pattern.
For example, suppose waves 1, 2 and 3 of a potential impulse have completed. In that case, it is often worthwhile to evaluate the possibility that those waves could actually be the A-B-C of a zigzag pattern. In this case, you would change the wave family to Corrective and then inspect the integrity of the alternate pattern using tools such as the Smart Tools.
See also Choosing a wave family.
Use this to automatically detect lower-degree subwaves between existing waves in a pattern or at the end of an incomplete wave pattern. See also Counting Subwaves.
Use this to automatically detect wave patterns on a lower timeframe between existing waves in a pattern or at the end of an incomplete pattern. See also Timeframe Drilldown.
Use this to project waves for incomplete patterns into the future. This is a powerful way to establish a forecast guideline for the probable path that price may follow based on an existing partial pattern. Using standard Elliott Wave expectations and statistical modelling, waves will be added to the chart to complete the incomplete pattern.
While the price levels in a projected pattern are based on probability, manual adjustments for timing are often required based on current market conditions. So, this feature is primarily intended to help you gauge the most likely price levels and basic structure for the future waves of a given pattern. It’s not designed to forecast timing.
Please note that this feature is only enabled for incomplete patterns.
This is a way to quickly set a price alert based on price crossing through a specific wave level. See also Setting Alerts and the Alerts gadget.
Use this to delete a wave (and any waves that follow) from an existing pattern.
Use this to delete all lower-degree subwaves that follow a given wave.
Select this option from any wave in a pattern to remove the entire pattern from the chart.
It’s not uncommon to track multiple wave counts until more clarity emerges regarding which wave count is the correct count. So, this feature is useful if you’d like to track more than one wave count in parallel on the same chart.
In the default Automatic mode, the wave drawing tool knows what you mean, so as you click to draw waves, you don’t have to worry about being very precise with where you place wave points.
As long as you click in the general area of the high or low turning point you’re targeting, wave labels will be automatically positioned in the correct places on the chart. You can change this behavior by choosing a different drawing mode from the menu, if you want more freedom with wave label placement.
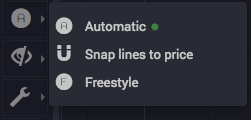
The 3 drawing modes…
(The default) – Waves and their points will automatically “snap” to the high and low turning points, and waves at multiple degrees will be automatically stacked, and if you draw waves that overlap at the same degree, the overlap will be automatically corrected. This is the easiest way to draw waves.
Wave anchor points will snap to high and low price turning points (so calculations will still be accurate in the insight tools), but you can put wave labels any distance you like from price.
Wave anchor points and wave labels may be placed anywhere you want. This can be useful for educational purposes, or just experimenting with scenarios, but since the wave anchor points may not be at actual price levels, the insight tools may show erroneous values.
Yes!
Simply drag your mouse cursor vertically on the price axis of the chart you want to adjust.
Hover your mouse cursor over any study and right click to delete it.
Unlike other tools that have made attempts to automate Elliott Wave analysis (and many manual practitioners), WaveBasis understands that there is always more than one possible valid wave count for a given market time period. Depending on the market and time period, the number of valid counts and their variations can number in the tens, hundreds, or even thousands.
It’s like asking every Elliott Wave expert in the world to produce a count for you, then having the time to sift through them all to find the ones with the highest statistical likelihood of describing the context and directional bias that a market finds itself in. WaveBasis does this and more in seconds.
And we think it’s just fun to use!
One of the most difficult aspects of applying the Elliott Wave methodology by hand is remembering all of the rules and guidelines that relate to each of the Elliott Wave patterns. Other automated tools either fail to apply the rules correctly, often producing invalid wave counts, or ignore the rules completely by doing things like substituting moving average crossovers as a proxy for true pattern detection.
Wave degree refers to the relative time frame that a given wave or pattern belongs to within a wave count. For example, a pattern that extends over a few days would generally be at a smaller/lower degree than one that extends over several weeks.
However, wave degree is a relative term, so don’t worry too much about choosing the “right” one. Whether or not you have a specific scenario in mind when drawing waves manually, it’s usually best to start a with a degree near the middle of the range (e.g., Primary), so that you have space to add waves at higher and lower degrees as you work through your analysis.
Also, one of the unique features of WaveBasis is that, if you prefer, you can simply focus on the Wave Family, and let the software manage wave degrees automatically. So, as you add new wave patterns to a chart, WaveBasis will keep the relative degrees organized properly for you.
The choices go from highest (Supermillennium) to lowest (Submicro).

The Wave Family is the type of wave pattern that you want to draw. This is the most important decision you have to make before drawing a wave pattern.
Simply choose a Wave Family from the dropdown menu as shown below to indicate what kind of wave pattern you’d like to draw, then click on the chart where you’d like the wave labels to appear.
If you want more flexible control over the wave labels or their placement, use the Wave Degree or Drawing Mode tools.

These simple options allow you to draw any type of Elliott Wave pattern without worrying about the details of specific individual patterns.
Easy-to-use tools for systematic, pro-caliber Elliott Wave analysis, without having to first become an expert…
Simply put, WaveBasis is a complete platform for analysis and automatic detection of Elliott Wave patterns in financial markets. It’s a workflow accelerator that aims to facilitate the application of traditional Wave analysis in the most natural and efficient way possible, while providing unique insights and innovative trading decision support.
The system has been designed from the ground up to put unprecedented power in the hands of both novice and experienced traders who appreciate the benefits of including Elliott Wave analysis in their arsenal of tools.
We’re reigning in the complexity (and mystery) normally associated with the Elliott Wave approach, with a combination of high-speed, intuitive tools, and a powerful pattern recognition engine, and we’re exceedingly proud and excited to introduce this technology to you through our unique new platform!
If you’re new to Elliott Waves, the WaveBasis tools will accelerate your learning, while at the same time they’ll provide immediately actionable insights – that can’t be found anywhere else – right from the first click.
If you’re already a more advanced Elliott Wave practitioner, WaveBasis will accelerate your workflow in ways you haven’t even dared to dream. You can produce complete valid wave counts in a fraction of the time that you’re used to, using a combination of our automated and manual tools (and our Smart Drawing Tools) – and without a calculator sitting next to your computer. WaveBasis anticipates your needs and speaks the same language you do.
It’s never been faster or easier to harness the power of Elliott Waves in your trading.