• Wave Counts

What is the best time frame for a wave count?

Elliott Wave analysis works the same way at any time frame, and so does WaveBasis.

So, the time frame(s) that you use for your wave counts is highly dependent on your trading style and objectives, particularly your preferences for trading time horizons (how long you intend to hold a trade). Other important factors to consider are the amount of time a market has been trading and whether or not it is a 24-hour market.

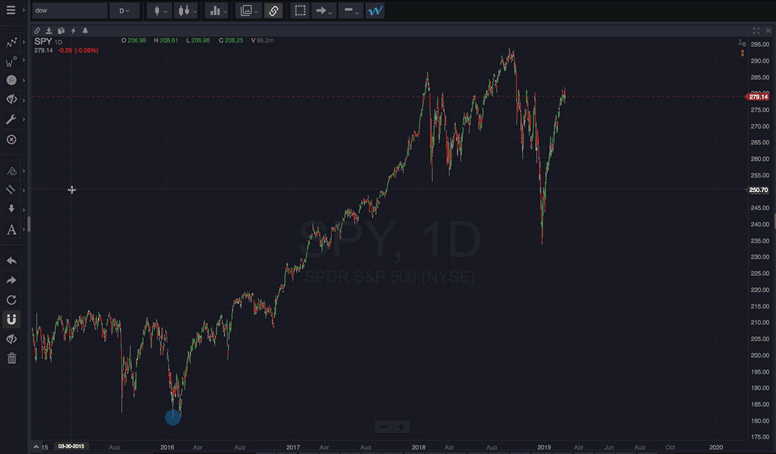
For example, an 8-hour chart wouldn’t make much sense for a US stock since the trading day is less than 8 hours, however, it is not uncommon to analyze 8-hour charts for forex or crypto markets. Further, a montly chart would not include much wave information for a market with a shorter (2-4 years or so) trading history, so a daily or weekly wave count would be more effective in most of these cases. So, there is no single “best” timeframe that works for all markets or all traders.

So, if you like longer-term trades (weeks, months, years), a daily, weekly, or monthly wave count will likely work best for you as a starting point to determine the longer-term wave count context.

If you prefer faster trades (minutes, hours, or days), then starting with a larger timeframe to determine the market context then drilling down to smaller timeframes (5, 15, 30, 60 minutes, etc.) to refine your analysis will tend to give you the best results.

As noted above, regardless of the timeframe that you choose to refine your trade entries and exits, for best results, it is recommended that you begin your analysis with a larger timeframe wave count, which will help to determine the overall context of a particular market. This approach will help you answer important questions such as “are we in a long term correction? or “are we near the top of a long term uptrend?”, for example. Once you have clarity on the larger context, you can work your way down to smaller time frame(s) as desired, according to your specific objectives.


A helpful article on our blog explores multi-timeframe analysis.

Read More
  • Frequently Asked Questions

How does the free trial work?

When you first sign up to WaveBasis, you have free access to a fully-functioning Trader plan subscription for 14 days. No credit card is required to do the free trial, and you are not obligated to continue with your subscription after the trial period ends.

If you fall in love with WaveBasis the way most people do, you can subscribe during your free trial, without ever leaving the application, by following the steps listed in our “How do I subscribe to a plan?” FAQ.

At the end of your free trial, if you haven’t entered your payment information and subscribed to one of our paid plans, your subscription will automatically switch to our Free plan. So, you don’t need to cancel your free trial if you find that WaveBasis isn’t for you right now. The platform will continue to be entirely free for you.

The Free plan allows you to use some of the features included with our paid plans; however, automatic wave count usage is more limited on the Free plan than on paid plans. You can learn more about our subscription plans.

During the Trader plan trial, you should take particular note of your automatic wave count usage, as well as which platform features you use. This is the best way to determine which plan level will be most suitable for you when you decide to subscribe. You can also learn more about wave count usage.

Please note that our policies allow for one free trial per person.

If you haven’t already signed up for your free trial, what are you waiting for? Sign up now!

Read More
  • Video Tutorials

A watch list with Elliott Wave power


Not only will the Watchlist gadget save you time when viewing charts for your most important markets, but by combining it with other WaveBasis features, you can quickly check wave counts at multiple timeframes for a list of markets. This video shows you how.

Read More
  • Wave Counts

How do I read a wave count?

The Wave Count Forecast gadget is a great way to learn how to read and interpret an Elliott Wave count as it automatically provides short-, medium-, and long-term forecasts for any wave count in your workspace.

Read More
  • The Gadgets

Wave Count Forecast

The Wave Count Forecast gadget automatically provides short-, medium-, and long-term forecasts for any wave count in your workspace.

The gadget also interprets and explains what wave counts are saying about the market, in easy-to-understand plain language. The forecasts are similar to what you might receive from an Elliott Wave newsletter or service.

It’s like having an Elliott Wave expert guiding you at all times!


Wave Count Forecast gadget


The Forecast gadget is a great way to reinforce your Elliott Wave knowledge and to improve your skill at interpreting wave counts. Discover the expert’s secrets for understanding what a wave count is telling you about a market’s likely next moves. More advanced traders can use the automatic forecasts as confirmation or comparison with their own wave count interpretations.


The Forecast gadget provides a customized forecast that is specific to any automatic wave count, including autocounts that you have modified. It will also display forecasts for manually drawn wave counts.


How do I use it?


Select the Wave Count Forecast gadget from one of the gadget menus, as you would any other gadget. Once the gadget is open in your workspace, it is automatically activated.

The gadget will show a complete forecast for the wave count displayed on your current chart. The forecast includes 2 main areas:

  • Directional Term Forecasts give you an at-a-glance assessment of a wave count’s projections. Short Term (ST), Medium Term (MT), and Long Term (LT) directional forecasts are displayed at the top of the gadget with icons colored red for bearish and green for bullish. Learn more about how to interpret this.
  • A Detailed Count Interpretation helps you understand the count and quickly build confidence in your trade thesis. The detailed commentary describes what the wave count is telling you about the market’s most probable next moves.


For best results, you can visually study the wave count on the chart in combination with reviewing the written forecast. This is an effective way to solidify your understanding of the forecast, which is a key step along the path to making a trading decision.


NOTE: It’s important to keep in mind that the Directional Term Forecasts are relative and specific to the time frame of the chart that you are analyzing. So, for example, the long term forecast for a wave count on a 5-minute chart has a different meaning and context than the long term forecast for a weekly chart. Be clear about your trading time horizon.


NOTE: Like most WaveBasis gadgets, the Forecast gadget is integrated with the charts in your workspace. So, if you navigate to another chart or tab, the Forecast gadget will stay in sync to display the forecast for your current chart.


If your plan includes the Next Subwaves gadget, the Forecast gadget is also included as a Next Subwaves companion. Access it by clicking the Count Forecast tab as shown below.


Read More
  • Charts

Can I save multiple charts in a layout?

No, not yet, but we’re working on this feature right now and it will be released soon!

Read More
  • Wave Drawing Tools

Drawing Partial Patterns

Another unique feature of WaveBasis is the ability to draw partial wave patterns. When you enable a wave drawing tool, you don’t have to draw all of the waves in the pattern you’ve selected.

This can be extremely useful when manually identifying incomplete patterns at the end of charts or wave counts. This is particularly powerful when combined with the Project Pattern Forward feature.

For example, if only waves 1 and 2 of an impulse appear to have completed, you can draw wave labels for just waves 1 and 2. Then, use Project Pattern Forward to automatically add a pattern forecast to the chart, to quickly establish expectations for upcoming waves – or trading opportunities.

See how to draw partial patterns by using the ESCape Key on your keyboard.

Read More
  • Working with Charts

Annotating Charts

Learn about adding drawings and other types of annotations to charts in the Drawing Basics section.

Learn about drawing manual Elliott Waves in the Wave Drawing Tools section.

Read More
  • Reference Guide

Drawing Basics

You can use the WaveBasis drawing tools to annotate charts in a wide variety of ways. From trend lines and Gartley patterns to freehand drawings and text annotations, there are over 35 drawing tools to choose from.

The basic drawing tools are located in the left toolbar grouped together into logical collections. When you hover your mouse cursor over a drawing tool button, a popup “tool tip” will display the name of the collection.

Clicking the arrow next to a tool button will open a menu to allow you to select one of the tools. Once you’ve selected a tool from the menu, it becomes active and you can immediately start drawing on your chart. If the icon for the tool that you want to use is already displayed on the tool button, you can simply click the button to activate it.


Usage Notes

  • To change the properties of a drawing, right-click on it and choose Settings… from the popup menu that appears.
  • To move a drawing to another place on the chart, simply drag-and-drop it.
  • To delete a drawing, right-click on it and choose Delete from the popup menu that appears.
  • When you save a chart, any drawings that you’ve added to the chart will be saved with it.
  • To cancel a drawing after you’ve started drawing on the chart, hit the ESCape key on your keyboard.


Read More
  • Reference Guide

Displaying Price Targets

Establishing realistic, high-probability price targets is an important aspect of successful trading, and a key element of Elliott Wave analysis. WaveBasis provides several integrated techniques for identifying price targets and displaying them on charts.

Read More